Summary of Project
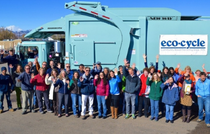
In Spring 2019, Eco-Cycle and 230 volunteer neighborhood “carbon farmers” in Boulder County launched the Community Carbon Farming Campaign as a pilot program to develop a climate solution in our own backyards. We had three goals:
- Determine if we can use community science (aka citizen science) to measure carbon sequestration in non-agricultural urban land. Contribute data to a larger network database that was created to quantify the potential of soil carbon sequestration and rebuilding lost topsoil as a key drawdown tool to reverse climate change;
- Educate ourselves as property managers on the best ways to manage our lawns and landscapes for carbon sequestration and resilience, and educate ourselves as consumers about regenerative agriculture and how we can support it with our purchase choices;
- Use what we learn from this project to create a model that individuals and communities elsewhere can adopt to further the above goals.
In Year 1 (2019 growing season), we took spring baseline soil samples and sent them to our lab partner to measure the starting level of organic carbon in the soil. We repeated the sampling in the fall to vet our trial design and get a sense of the rate of change.
In Year 2 (2020 growing season), we determined from the Year 1 results that the rate of change was too slow to justify annual soil sampling. Instead, we used the LandPKS app developed by the USDA to familiarize ourselves with our own soil and the features of our yards that form our backyard microclimate.
In Year 3 (2021 growing season), we took final soil samples in the fall. Our final results look at the change in organic carbon in our soils compared to the 2019 baseline samples for each of the 5 different soil treatments used in the trials (compost, inoculated biochar, biodynamic preparation, mycorrhizal inoculant, and foliar mineral spray).
Year 3 Data
For each of the five treatments, the chart below shows the difference (delta) between the averaged fall 2021 and spring 2019 baseline data for both the treatment (test) and the control plots. The averaged values themselves are also shown in the two tables under the chart. This chart uses only complete data sets from individual trials to calculate the averages.
For simplicity, we’ve shown the data only as Soil Organic Matter (SOM). Total Carbon, the percentage of carbon that is fully stable in the soil (“carbon sequestered,” if a positive number) is 58% of SOM. Also, note that the depth filter on the right is set at 5 cm for the default view because carbon sequestration happens close to the surface first.
To see your own results, enter your site ID—the first 3 letters of your first name, then a space, then the first 3 letters of your last name (or the person in your household who initially registered with the project) in the empty field at the upper right of the charts.
